Abstract
Part 1/3
Florence Nightingale’s innovative “rose diagram” of preventable deaths revolutionized data-driven disease surveillance. Raw hospital mortality data collected during the Crimean War were transformed into a compelling, visual insight — poor sanitary conditions killed more people than battle wounds did. This act of synthesizing noisy, complex data into an elegant, effective message was the foundation for a royal commission to track morbidity and mortality and thus launched a new era in which analytic methods were used to better monitor and manage infectious disease. In the more than 160 years since the first publication of Nightingale’s rose diagram, tools and technology for translating high-density data and uncovering hidden patterns to provide public health solutions have continued to evolve. Manual techniques are now complemented by machine learning algorithms. Artificial intelligence (AI) tools can now identify intricate, previously invisible data structures, providing innovative solutions to old problems. Together, these advances are propelling infectious-disease surveillance forward.
💡 回溯历史,将监测方式的转变: noisy, complex data➡️elegant, effective diagram➡️manual techniques➡️machine learning algorithms
❓︎ 这个是摘要,为啥要这样子写?感觉更像是背景,但是这个论文没有背景部分。
Part 2/3
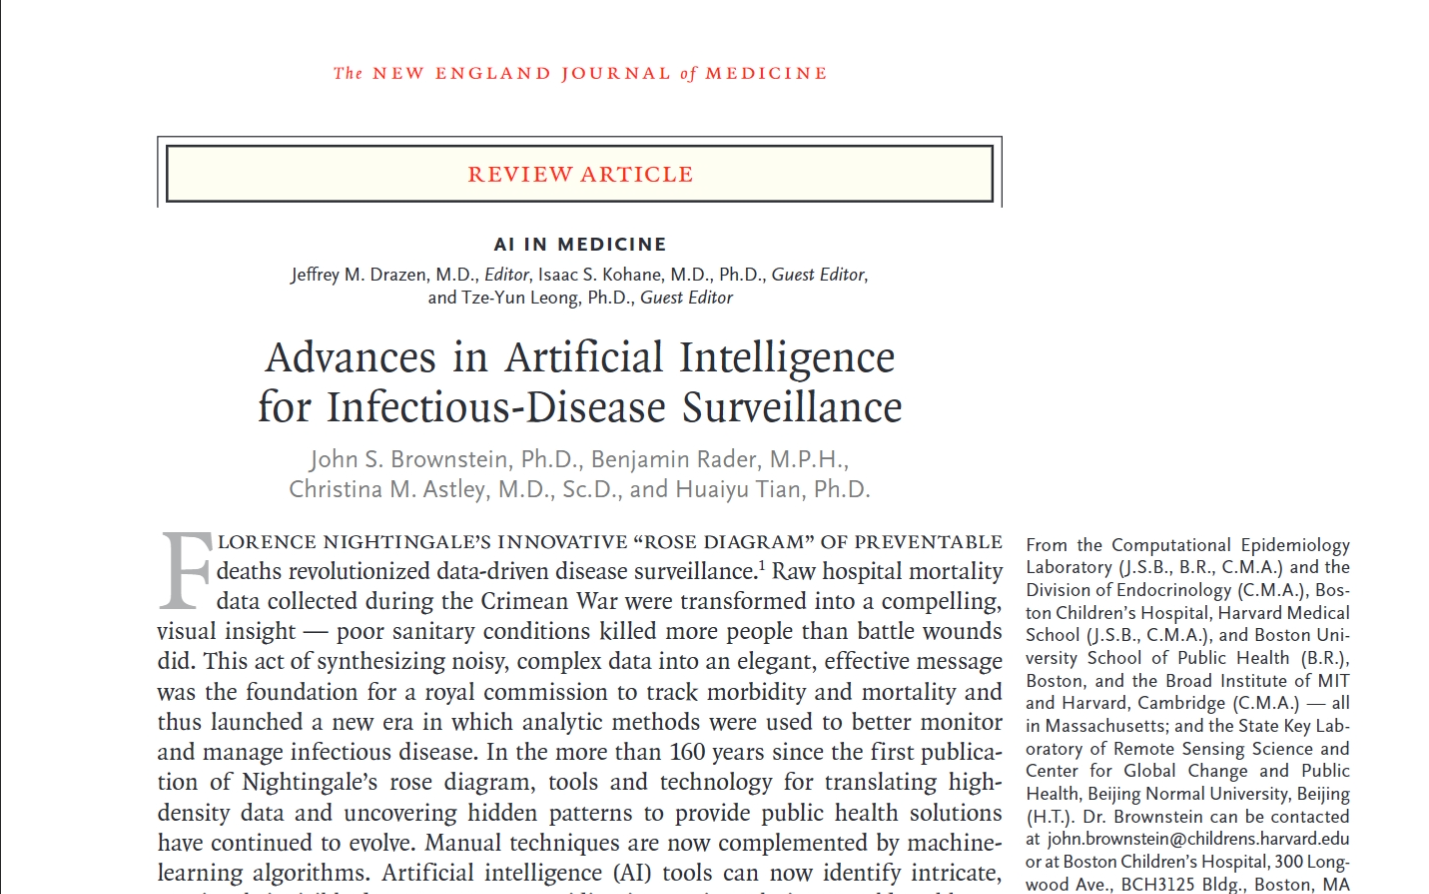
The coronavirus disease 2019 (Covid-19) pandemic has highlighted the speed with which infections can spread and devastate the world — and the extreme importance of an equally nimble, expeditious, and clever armamentarium of public health tools to counter those effects. Throughout this crisis, we have witnessed a multitude of AI solutions deployed to play this role — some much more successful than others. As new pathogens emerge or old challenges return to command our attention, the incorporation of the lessons learned into our public health playbook is a priority. In this review article, we reflect on the effects of new and longstanding AI solutions for infectious-disease surveillance. AI applications have been shown to be successful for a diverse set of functions, including early-warning systems,2,3 hotspot detection,4,5 epidemiologic tracking and forecasting,6,7 and resource allocation8 (Fig. 1). We discuss a few recent examples.9,11,12 We begin with how AI and machine learning can power early-warning tools and help distinguish among various circulating pathogens (e.g., severe acute respiratory syndrome coronavirus 2 SARS-CoV-2 vs. influenza virus). We then discuss AI and machine-learning tools that can backtrack epidemics to their source and an algorithmic method that can direct an efficient response to an ongoing epidemic. Finally, we emphasize the critical limitations of AI and machine learning for public health surveillance and discuss salient considerations to improve implementation in the future.
💡 介绍文章的结构
❓︎ 这个综述与系统综述不一样。
基本介绍
《Advances in Artificial Intelligence for Infectious-Disease Surveillance》 2023年4月27日以Review形式发表在《The New England Journal of Medicine》。作者分别来Harvard Medical School, Beijing Normal University.
文章结构
- Abstract - 从南丁格尔玫瑰图到AI,总结COVID-19中AI技术应用
- AI application in disease surveillance
- Early warning
- Pathogen classification
- Risk assessment
- Source identification
- Hotspot detection
- Tracking and forecasting
- Extended applications
- Surveillance roadblocks and future directions
- Data volume and quality
- Data source representation
- Privacy
- The limits of AI
Abstract
Part 1/3
Florence Nightingale’s innovative “rose diagram” of preventable deaths revolutionized data-driven disease surveillance. Raw hospital mortality data collected during the Crimean War were transformed into a compelling, visual insight — poor sanitary conditions killed more people than battle wounds did. This act of synthesizing noisy, complex data into an elegant, effective message was the foundation for a royal commission to track morbidity and mortality and thus launched a new era in which analytic methods were used to better monitor and manage infectious disease. In the more than 160 years since the first publication of Nightingale’s rose diagram, tools and technology for translating high-density data and uncovering hidden patterns to provide public health solutions have continued to evolve. Manual techniques are now complemented by machine learning algorithms. Artificial intelligence (AI) tools can now identify intricate, previously invisible data structures, providing innovative solutions to old problems. Together, these advances are propelling infectious-disease surveillance forward.
💡 回溯历史,将监测方式的转变: noisy, complex data➡️elegant, effective diagram➡️manual techniques➡️machine learning algorithms
❓︎ 这个是摘要,为啥要这样子写?感觉更像是背景,但是这个论文没有背景部分。
Part 2/3
The coronavirus disease 2019 (Covid-19) pandemic has highlighted the speed with which infections can spread and devastate the world — and the extreme importance of an equally nimble, expeditious, and clever armamentarium of public health tools to counter those effects. Throughout this crisis, we have witnessed a multitude of AI solutions deployed to play this role — some much more successful than others. As new pathogens emerge or old challenges return to command our attention, the incorporation of the lessons learned into our public health playbook is a priority. In this review article, we reflect on the effects of new and longstanding AI solutions for infectious-disease surveillance. AI applications have been shown to be successful for a diverse set of functions, including early-warning systems,2,3 hotspot detection,4,5 epidemiologic tracking and forecasting,6,7 and resource allocation8 (Fig. 1). We discuss a few recent examples.9,11,12 We begin with how AI and machine learning can power early-warning tools and help distinguish among various circulating pathogens (e.g., severe acute respiratory syndrome coronavirus 2 SARS-CoV-2 vs. influenza virus). We then discuss AI and machine-learning tools that can backtrack epidemics to their source and an algorithmic method that can direct an efficient response to an ongoing epidemic. Finally, we emphasize the critical limitations of AI and machine learning for public health surveillance and discuss salient considerations to improve implementation in the future.
💡 介绍文章的结构
❓︎ 这个综述与系统综述不一样。
Part 3/3
AI applications in disease surveillance
Early warning
背景
At any given moment, the Web is flooded with disease reports in the form of news articles, press releases, professional discussion boards, and other curated fragments of information. … However, the volume and distributed nature of these reports constitute much more information than can be made sense of promptly by even highly trained persons, making early warning of emerging viruses nearly impossible.
解决办法
AI-trained algorithms that can parse, filter, classify, and aggregate text for signals of infectious-disease events with high accuracy at unprecedented speeds.
举例
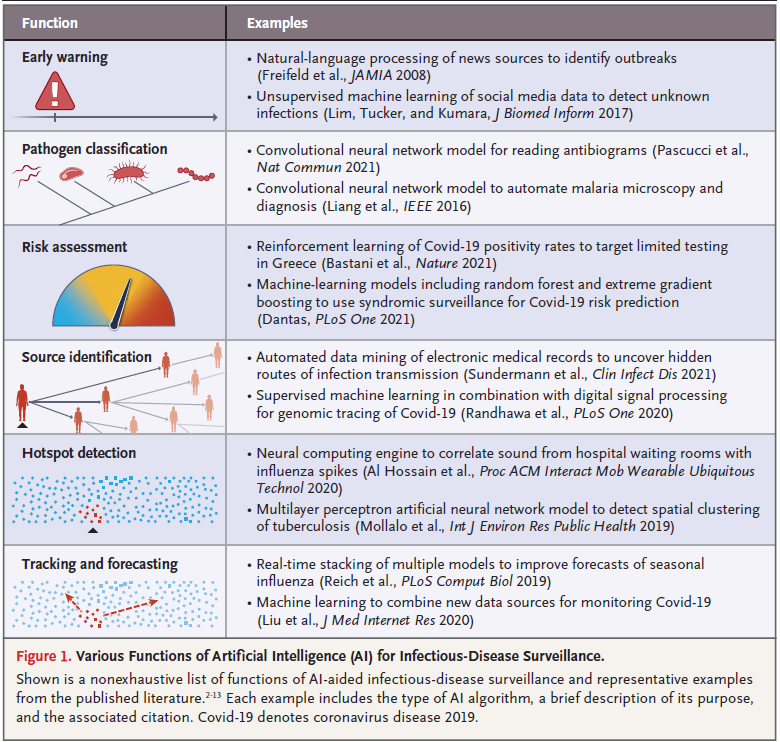
- HealthMap
- H1N1 in Mexico
- vaping-induced pulmonary disease in US
实现
natural-language processing to search through text posted across the Web for signals of infectious-disease events in real time by comparing the text with a dictionary of known pathogens and geographic areas.
ignore noise and parse relevant reports by identifying disease-related text such as the name of a pathogen and incidence numbers.
HealthMap also automatically extracts geographic information that can be used to tie multiple reports together and identify disease clusters that cross-jurisdictional public health authorities may have missed.
Continuously expanding dictionary with text in more than nine languages. … the ability to simultaneously provide worldwide coverage and hyperlocal situational awareness.
Pathogen classification
背景
AI has led to advances in diagnostic classification in a variety of fields, including neuroimaging (e.g., improving diagnostic tests for Alzheimer’s disease) and oncology (e.g., detecting breast cancer).
实现
症状监测
By defining the pathologic characteristics of an outbreak, public health authorities are able to respond accordingly (e.g., by ensuring an adequate supply of oseltamivir when influenza cases are increasing in a region).
reliance on simple syndromic definitions can result in misidentification of an outbreak, particularly when pathogens share symptoms and routes of transmission. For example, a “Covidlike illness” syndrome suggested a false wave of Covid-19 in Canada, whereas pathogen data instead pointed to circulating seasonal viruses such as enterovirus or rhinovirus.
实现
耐药菌识别
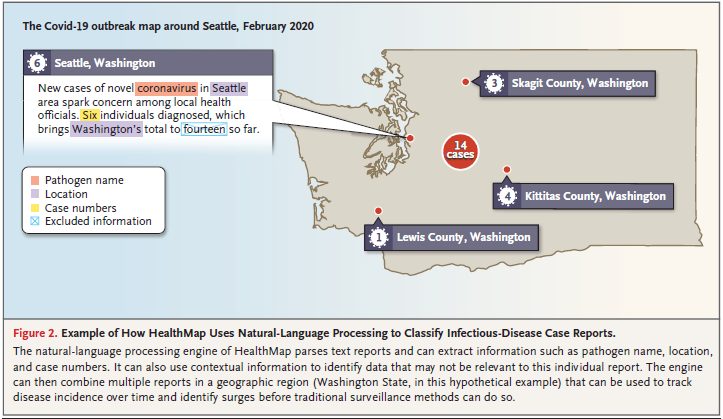
Kirby–Bauer disk-diffusion test is a simple, low-cost technique for determining bacterial susceptibility to drugs from the diameter of the area in which growth of the bacteria is inhibited around an antibiotic-treated disk in a petri dish.
measurement quality is user-dependent and can result in misclassification of bacterial as susceptible or resistance.
- 图像识别:量化抑菌圈直径
- 深度学习:专家系统给出结果
- 自动化:自动上传至WHO数据库
Source identification
背景
When an outbreak has been identified, the next step is to stop the outbreak by first tracing and then cutting off routes of transmission. For hospital-based outbreak detection, tracking of infections with the use of spatiotemporal clustering and contact tracing can be performed by hand to identify targets for intervention.
Genetic similarities of whole-genome surveillance sequences can also be used to tie clinical cases together. However, this method cannot be used to identify sources of infection, and even when used in conjunction with traditional hospital-based outbreak detection, it may fail to identify complex transmission patterns, knowledge of which is required to direct interventions.
实现
EDS-HAT: 结合基因组监测数据和机器学习
The algorithm was trained by means of a case–control method that parsed the EMR data from patients known to have infections from the same outbreak (cases) and EMR data from other patients in the hospital (controls used to establish baseline levels of exposure relatedness). … real-time machine learning based on EMRs in combination with whole-genome sequencing could prevent up to 40% of hospital-borne infections in the nine locations studied and potentially save money.
识别隐匿传播的院内感染:耐甲氧西林金黄色葡萄球菌和铜绿假单胞菌
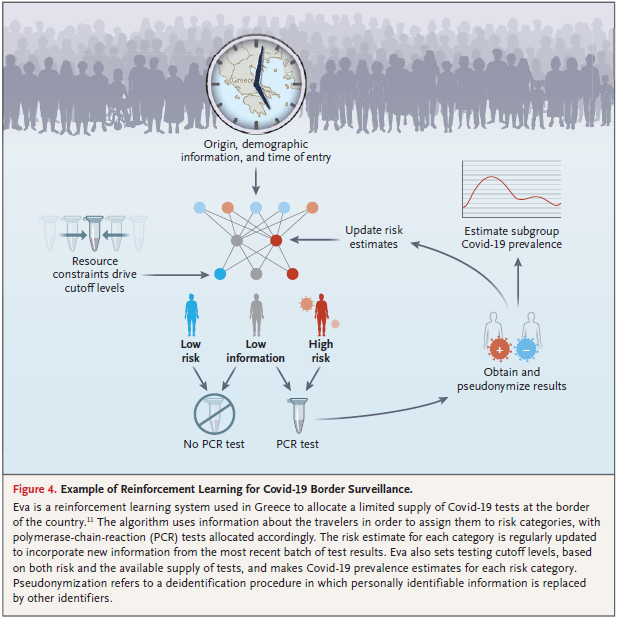
Risk assessment
背景
For widespread infections such as those that occur in pandemics, complete elimination of infection at a single source is unlikely. In these scenarios, vaccination, contact tracing, and non-pharmaceutical interventions such as movement restrictions and mask wearing can be used to reduce transmission.
举例
- QR codes in China
- Medical Chatbots
- Eva in Greece
Extended applications
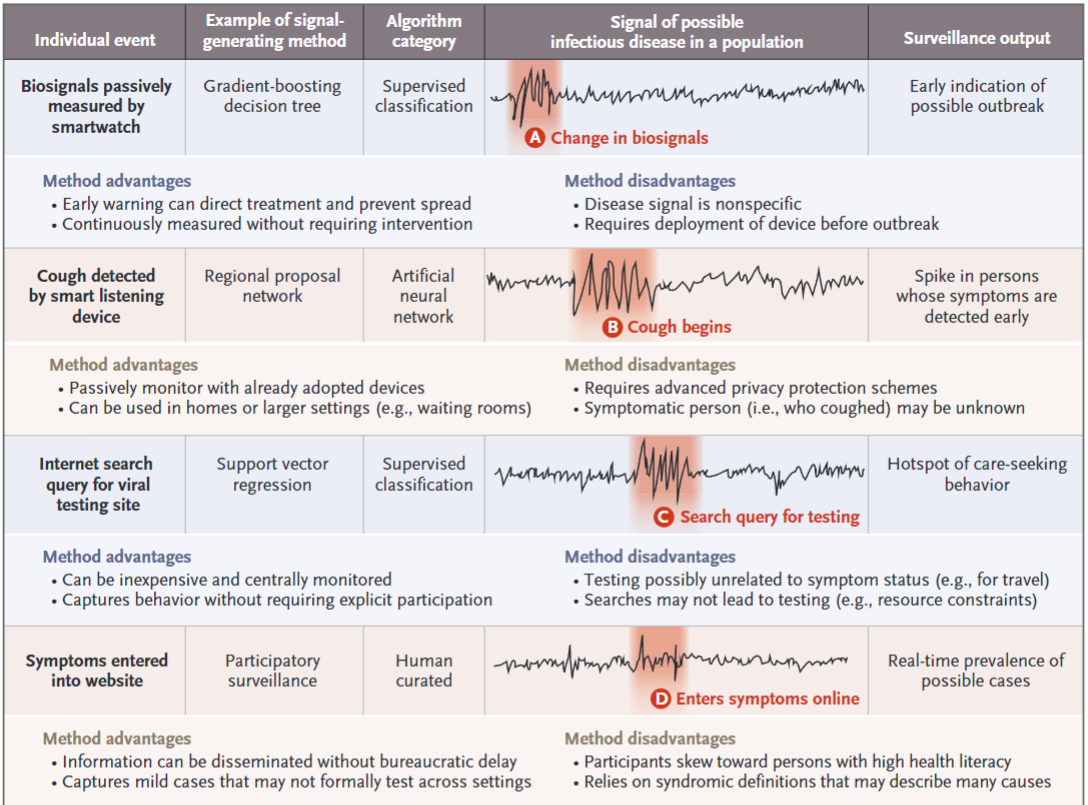

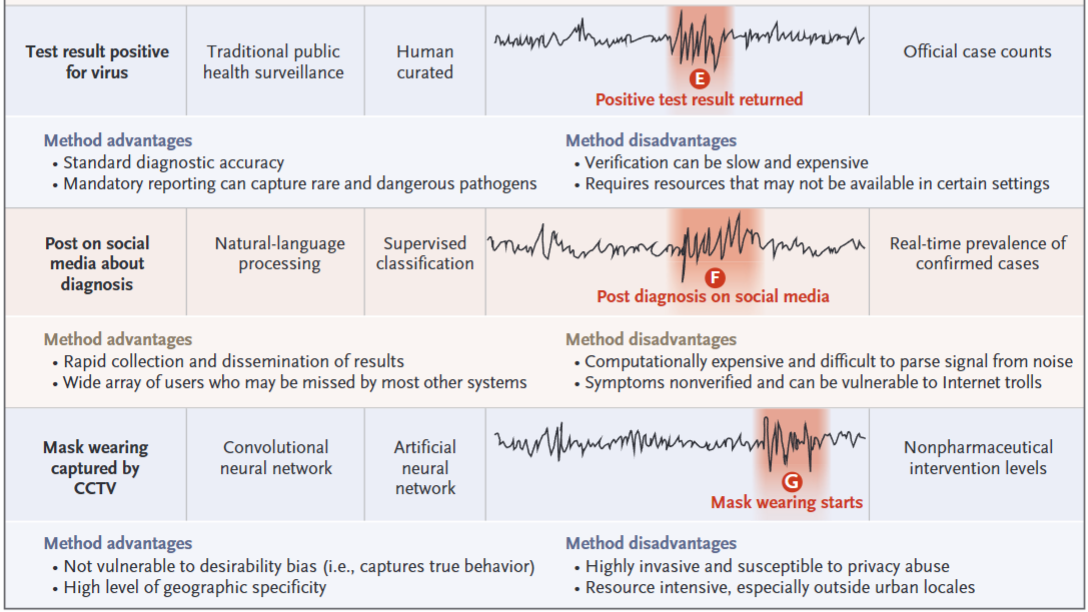
智能手表心率变化 -> 手机识别症状 -> 网络检索检测机构 -> 网络检索相关症状 -> 检测阳性率上升 -> 社交媒体相关诊断增加 -> 社交场所口罩佩戴人群增加
These AI-driven approaches complement the human-curated ones, including traditional public health surveillance, which is highly accurate but has a longer latency, and participatory surveillance, which can produce insights in real time but lacks the confirmatory nature of traditional reporting.
Surveillance roadblocks and future directions
Data volume and quality
"Big data hubris” reminds us that even the most accurate AI-trained infectious-disease surveillance systems can lead to over-fitting (i.e., predictions that are not generalizable because they are too tailored to specific data) and should complement rather than replace high-quality traditional surveillance.
Disease-tracking systems that are not supplemented by molecular testing may not be able to disentangle co-circulating infections that have similar clinical manifestations.
AI algorithms designed for surveillance of diseases such as Covid-19 will require frequent recalibration as new pathogen variants emerge and exogenous variables.
machine-learning algorithms trained on low-quality data will not add value, and in some circumstances they may even be harmful.
Data source representation
- 年龄?
- 性别?
- 种族?
Privacy
- 用户数据上传至服务器
- 用户数据过度收集
The limits of AI
AI can not replace the cross-jurisdictional and cross-functional coordination.